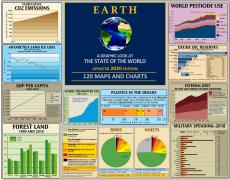
Plastic
The essential data about plastic explained in 7 infographics. Detailed charts covering mismanaged plastic waste, estimates of global plastic waste, global plastic production and waste, world plastic production and more. Learn the truth about plastic and how it relates to the state of the world on The Global Education Project website with un-biased facts from the most reliable sources. The amount of plastic debris that ends up in the oceans from the land is mostly determined by population size living within 50km of a coast and by the amount of plastic waste that is mismanaged—either littered or disposed into uncontained dumps or landfills....
 "Recycling delays, rather than avoids, final disposal. It reduces future plastic waste generation only if it displaces primary plastic production; however, this displacement is extremely difficult to establish.
"Second, plastics can be destroyed thermally....
"Recycling delays, rather than avoids, final disposal. It reduces future plastic waste generation only if it displaces primary plastic production; however, this displacement is extremely difficult to establish.
"Second, plastics can be destroyed thermally....
 Packaging represents 26% of the total volume of plastics used. Even when managed adequately, the process of recycling plastic ultimately produces a lower quality product and the required shipping, washing, chopping and melting also has a detrimental...
 Over 90% of plastics produced are derived from virgin fossil feedstocks—accounting for about 6% of global oil consumption. This is equivalent to the total oil consumption of the global aviation sector.

This section is an overview of the steep and rapid rise in the production and use of plastics; plastic waste management and mis-management; recycling; and the prevalence of microplastic debris in the environment.
 Rivers are a major pathway for plastic transport into the seas. Ten rivers: the Yangtze, Indus, Yellow, Hai He, Ganges, Pearl, Amur and Mekong in Asia; and the Nile and the Niger in Africa contribute about 90% of all river-driven plastics into the sea.
Page 1 of 1
Sign up for EARTH Dispatches
Enter you email below to get jaw dropping charts and maps delivered straight to your inbox.
Get the EARTH presentation
A 150 page high-resolution PDF containing all updated maps, charts and data on EARTH website; use as an information-packed educational slide show, printed booklet or a set of single-page handouts.
Learn More