Table of Revenue, Debt, Inequality, and CO2 Emissions of the most Powerful Countries and Corporations

The above chart compares the world's largest trans-national corporations with the wealthiest countries and nuclear powers: Revenue, Debt, Wealth Inequality, and CO2 Emissions.
2005 version of this table
More Wealth & Inequality Infographics


Sources
Country revenues, external debt, current account balance: CIA Factbook 2019, www.cia.gov/library/publications/the-world-factbook
Nuclear Weapons: Federation of American Scientists, fas.org
CO2 emissions: Global Carbon Project, cited at Our World in Data, ourworldindata.org/co2-and-other-greenhouse-gas-emissions;
Paris Agreement: UNFCC, https://unfccc.int/
Income share (most current year avail.): World Bank Development Indicators, data.worldbank.org/indicator
Tags: trans-national corporations, wealth, military, economic inequality, external debt, revenues, carbon dioxide emissions, kyoto protocol, paris agreement, wealth distribution, nuclear powers, corporate profit, revenue, debt, inequality, and co2 emissions of the most powerful countries and corporations, wealth-inequality
Sign up for EARTH Dispatches
Enter you email below to get jaw dropping charts and maps delivered straight to your inbox.
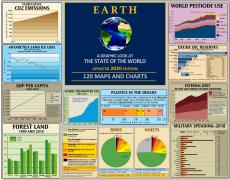
Get the EARTH presentation
A 150 page high-resolution PDF containing all updated maps, charts and data on EARTH website; use as an information-packed educational slide show, printed booklet or a set of single-page handouts.
Learn More