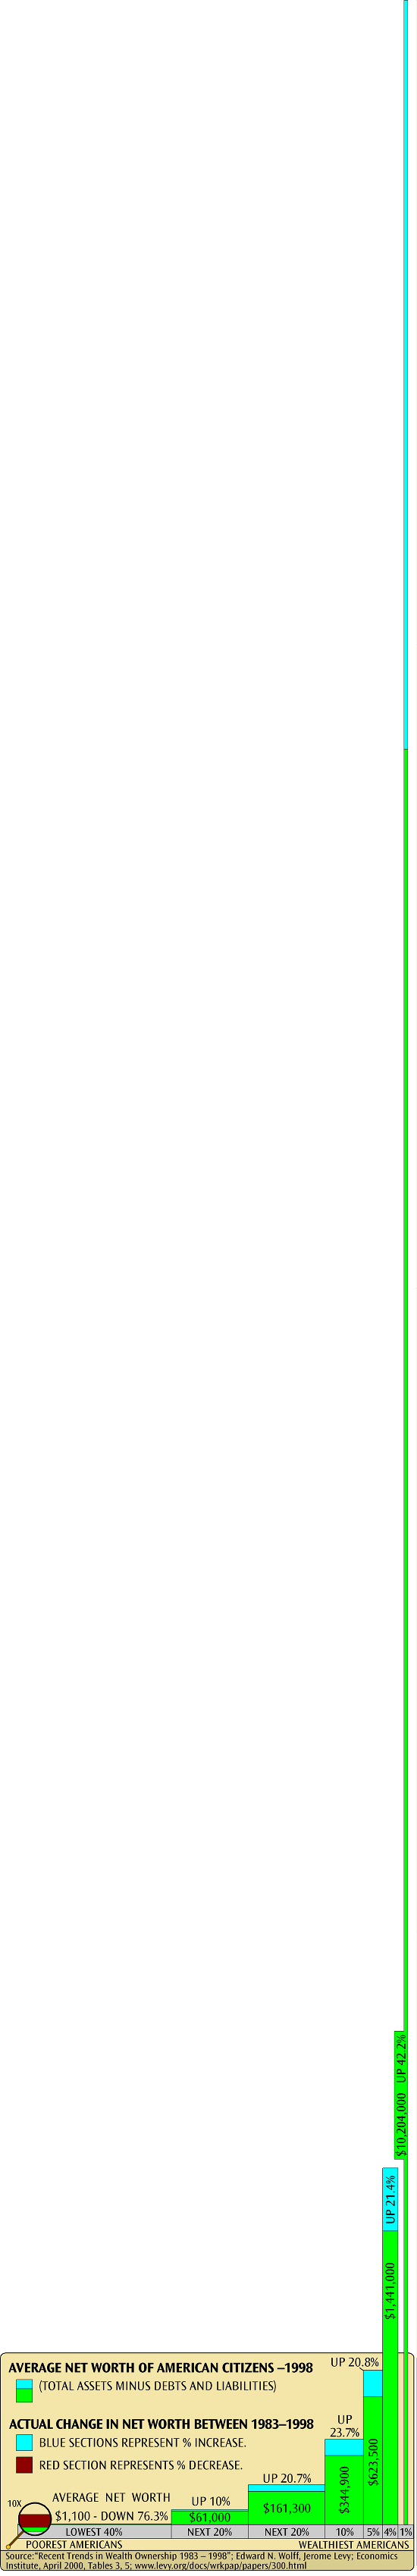
Chart of The Wealthiest Americans

2005 version of this chart
More Wealth & Inequality Infographics


Sources
Forbes: www.forbes.com/forbes-400
Tags: income inequality, economic inequality, wealth in the united states, income distribution, wealthiest 1%, wealthiest 10%, the one percent, equality, the wealthiest americans, wealth-inequality
Sign up for EARTH Dispatches
Enter you email below to get jaw dropping charts and maps delivered straight to your inbox.
Get the EARTH presentation
A 150 page high-resolution PDF containing all updated maps, charts and data on EARTH website; use as an information-packed educational slide show, printed booklet or a set of single-page handouts.
Learn More